상호작용과 성과 분석
문제 정의
사용자들의 학습성과를 높이려면?
기능 구현을 하면서 사용자들의 학습 성과를 높이려면 어떤 요소가 중요한지 고민하며 분석을 진행했다.
데이터는 Kaggle의 ONLINE EDUCATION SYSTEM REVIEW 데이터를 사용했으며
실제 프로젝트 데이터는 양이 적어 편향된 결과를 가져올 수 있어 제외했다.
데이터 전처리
1
2
3
4
import pandas as pd
data = pd.read_csv('../kaggle/ONLINE EDUCATION SYSTEM REVIEW.csv')
data.head()
data.shape # 1033개의 행, 23개의 열
결측치 확인
1
print(data.isnull().sum())
결측치 없음
범주형 개수 확인
1
2
3
4
5
6
7
8
9
10
11
12
13
14
15
16
data.info()
data.nunique()

data['Gender'].nunique() # 2
data['Home Location'].nunique() # 2
data['Level of Education'].nunique() # 3
data['Device type used to attend classes'].nunique() # 3
data['Economic status'].nunique() # 3
data['Are you involved in any sports?'].nunique() # 2
data['Do elderly people monitor you?'].nunique() # 2
data['Interested in Gaming?'].nunique() # 2
data['Have separate room for studying?'].nunique() # 2
data['Engaged in group studies?'].nunique() # 2
data['Average marks scored before pandemic in traditional classroom'].nunique() # 10
data['Interested in?'].nunique() # 3
data['Your level of satisfaction in Online Education'].nunique() # 3
이상치 확인
1
data.describe()
계산 가능한 데이터들 가운데 평균과 중앙값(50%)의 차이가 크지 않은것으로 보아
특이점이나 이상치가 크지 않은 것으로 보인다.
상관 분석
1
2
3
import plotly.express as px
corr_matrix = data._get_numeric_data().corr().round(2)
px.imshow(corr_matrix, text_auto=True, width=930, height=930)
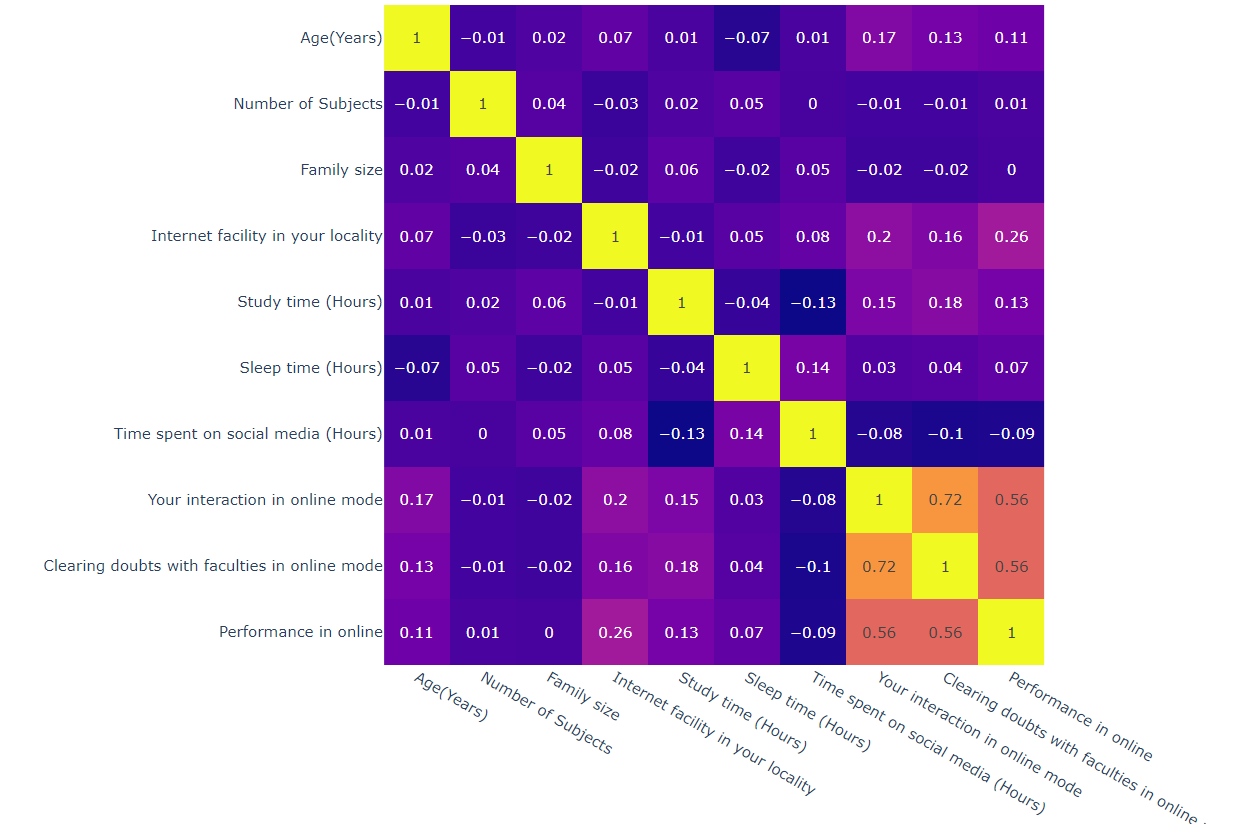
Your interaction in online mode와 Performance in online의 상관계수 : 0.56
Your interaction in online mode와 Clearing doubts with faculties in online mode의 상관계수 : 0.72
사용자의 상호작용 수준이 높을수록 학습 성과가 높을 가능성이 있다.
가설 설정
상호작용 수준이 높을수록 학습 성과가 높을 것이다.
데이터 확인
1
2
data['Performance in online'].describe()
data['Your interaction in online mode'].describe()
데이터 시각화 및 분석
산점도
1
2
3
import plotly.express as px
fig = px.scatter(x='Your interaction in online mode', y='Performance in online', data_frame=data, trendline="ols") # 추세선 추가
fig.show()
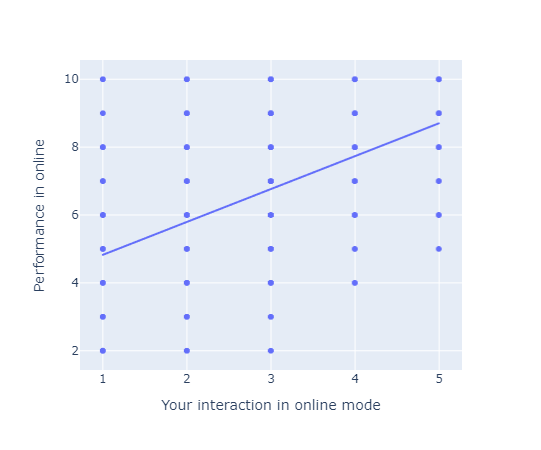
격자 형태로 나타나 관계 패턴을 명확히 확인하기 어려워 boxplot으로 분석을 진행했다.
Boxplot
1
2
3
import plotly.express as px
fig = px.box(data, x="Your interaction in online mode", y="Performance in online", points="outliers")
fig.show()
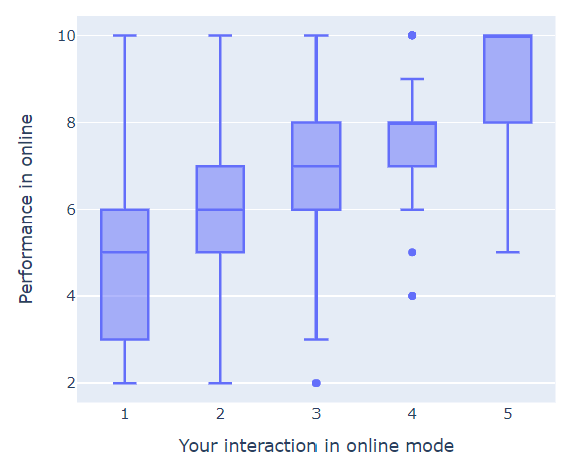
3과 4에서 이상치가 발견되었다.
x=1에서 중앙값이 50%에서 살짝 위에 형성되었다.
x=4, 5에서 중앙값이 Q3(상위 75%)와 같은 수준으로 높게 나타났다.
→ 상호작용이 많을수록 성과 상승 가능성 증가
그래프에서 이상치가 존재하여 IQR을 통해 Performance in online의 이상치 개수가 37개로 나왔으나
describe()를 통해 mean과 50% 데이터의 차이가 크지 않으며
min과 max 모두 정상범주에 있어 이상치를 제거하지 않고 실행했다.
Spearman 상관분석
1
2
3
4
5
6
7
8
9
10
11
12
13
14
from scipy.stats import spearmanr

corr, p = spearmanr(
    data["Your interaction in online mode"],
    data["Performance in online"]
)

print(f"Spearman 상관계수: {corr:.3f}")
print(f"p-value: {p:.4f}")

if p < 0.05:
    print("순위 상관관계 존재")
else:
    print("유의한 상관관계 없음")
1
2
3
Spearman 상관계수: 0.522
p-value: 0.0000
순위 상관관계 존재
정규성 검정
데이터는 서열형 변수이며 정규분포를 가정하기 어려우므로
비모수 검정인 Kruskal-Wallis 검정을 수행했다.
몇개의 범주로 나눠야 하는지 체크했다.
히스토그램
1
2
3
4
5
sns.histplot(data["Performance in online"])
plt.show()

sns.histplot(data["Your interaction in online mode"], discrete=True)
plt.show()
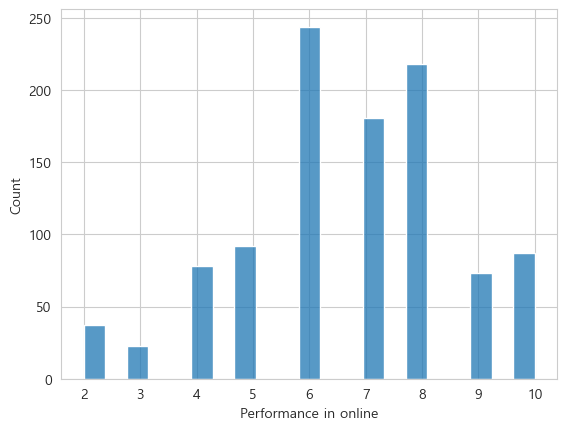
- 2 ~ 3 : 낮은 분포
- 6 ~ 8: 높은 분포 (집중됨)
- 4 ~ 5, 9 ~ 10: 중간 정도의 분포
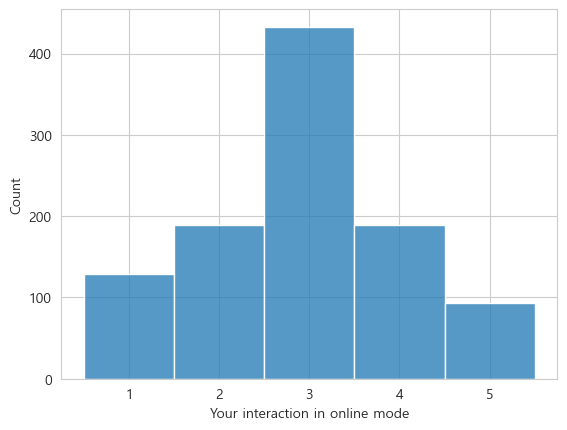
- 3에 데이터가 가장 많고 나머지는 비슷한 수준
그룹 생성
1
2
3
4
5
6
7
import pandas as pd

data["interaction_group"] = pd.qcut(
    data["Your interaction in online mode"],
    q=3,
    labels=["낮음", "보통", "높음"]
)
위와 같이 하려 했으나
1
2
ValueError: Bin edges must be unique: Index([1.0, 3.0, 3.0, 5.0], dtype='float64', name='Your interaction in online mode').
You can drop duplicate edges by setting the 'duplicates' kwarg
와 같이 에러가 떴다.
그래서 직접 구간을 정의했다.
1
2
3
4
5
data["interaction_group"] = pd.cut(
    data["Your interaction in online mode"],
    bins=[0,2,3,5],
    labels=["낮음","보통","높음"]
)
*histogram을 통해 값 3에 데이터가 가장 많이 집중되어 있었고 1 ~ 2와 4 ~ 5 구간은 유사한 분포를 보였다.
Boxplot (그룹 기준)
1
2
3
4
5
6
7
8
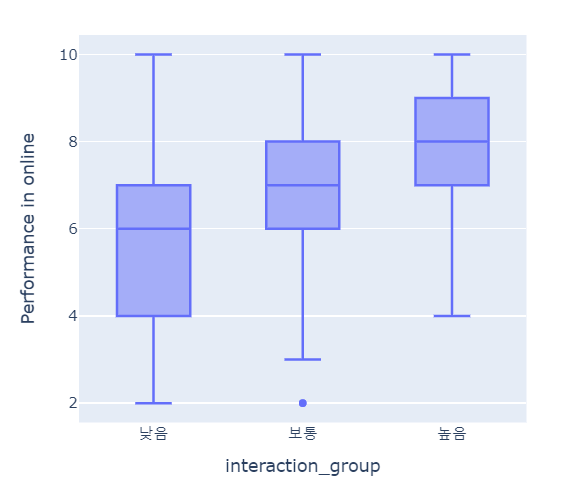
fig = px.box(
data,
x="interaction_group",
y="Performance in online",
points="outliers"
)
fig.show()
Kruskal-Wallis 검정
H0 : 모든 그룹의 중앙값이 같다
H1 : 적어도 하나의 그룹 중앙값이 다르다
1
2
3
4
5
6
7
8
9
10
11
12
13
14
15
from scipy import stats

low = data[data["interaction_group"] == "낮음"]["Performance in online"]
mid = data[data["interaction_group"] == "보통"]["Performance in online"]
high = data[data["interaction_group"] == "높음"]["Performance in online"]

H, p = stats.kruskal(low, mid, high)

print(f"Kruskal-Wallis H-statistic: {H:.2f}")
print(f"p-value: {p:.2f}")

if p < 0.05:
    print("그룹 간 중앙값 차이가 존재")
else:
    print("유의한 차이 없음")
1
2
3
Kruskal-Wallis H-statistic: 263.94
p-value: 0.00
그룹 간 중앙값 차이가 존재
결론
상호작용이 많을수록 학습성과가 높아지는 것을 확인했다. (Spearman ρ ≈ 0.52, p < 0.05)
상호작용 수준을 세 그룹으로 구분하여 수행한 Kruskal-Wallis 검정에서도
그룹 간 학습 성과 중앙값의 유의미한 차이가 확인되었다 (p < 0.05)
따라서 온라인 학습 환경에서 사용자의 상호작용을 높이는 기능이나 학습 활동을 제공하는 것이
학습 성과 향상에 긍정적인 영향을 줄 가능성이 있다.